Trade Analysis for Thursday:
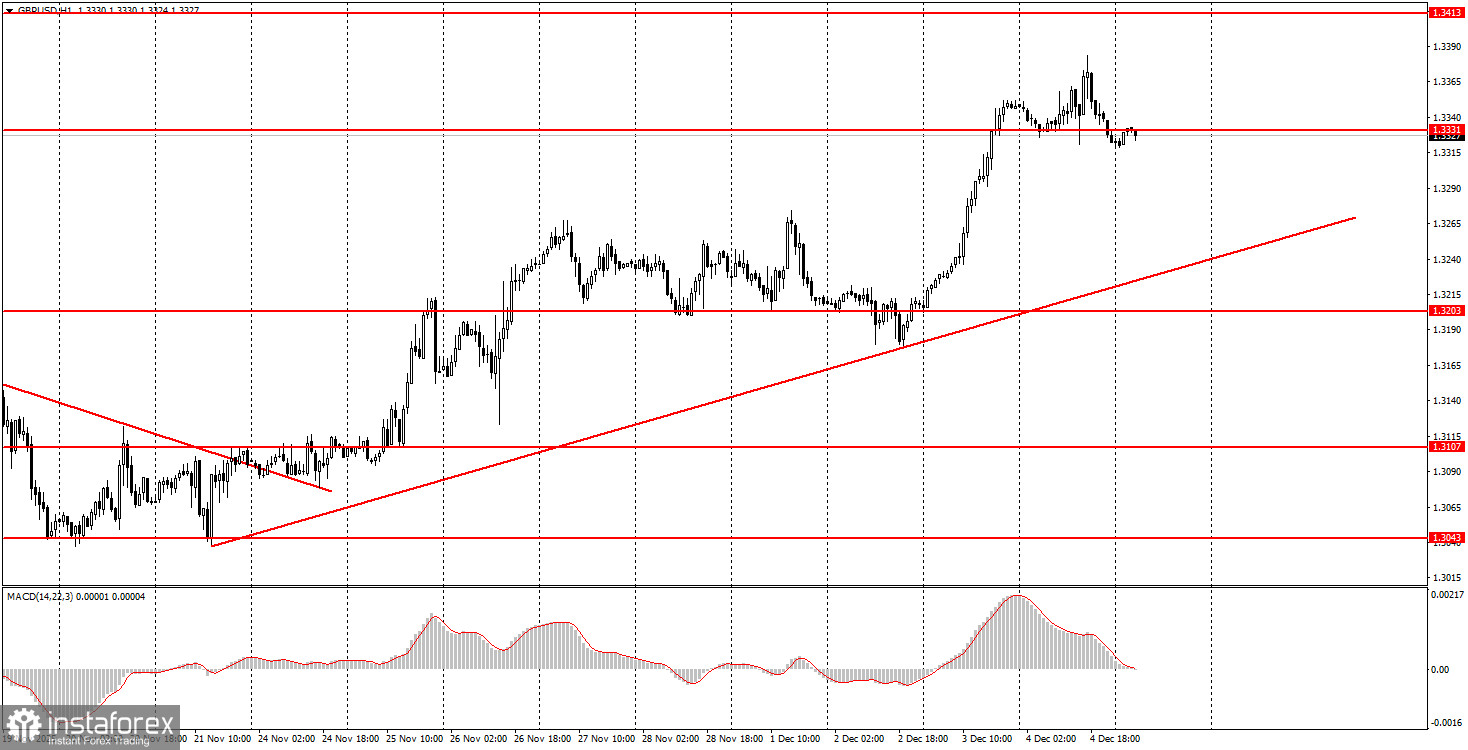
1H Chart of the GBP/USD Pair
The GBP/USD pair attempted to extend its upward move on Thursday, but the market calmed after a volatile Wednesday and was unable to push it significantly higher. Nevertheless, the local upward trend on the hourly timeframe is maintained, so it is reasonable to expect and hope for continued growth. On Thursday, there were no significant events or reports in the UK, while in the US, traders had to settle for a less important unemployment claims report. The report turned out to be much better than forecasts, as the number of new initial claims was significantly lower. The dollar received a slight boost in the afternoon, but overall, its fundamental background remains extremely weak. The GBP/USD pair has been correcting downwards for five months; sooner or later, the global upward trend should resume. Next week, there will be an FOMC meeting, and the probability of a third consecutive rate cut is almost 100%.
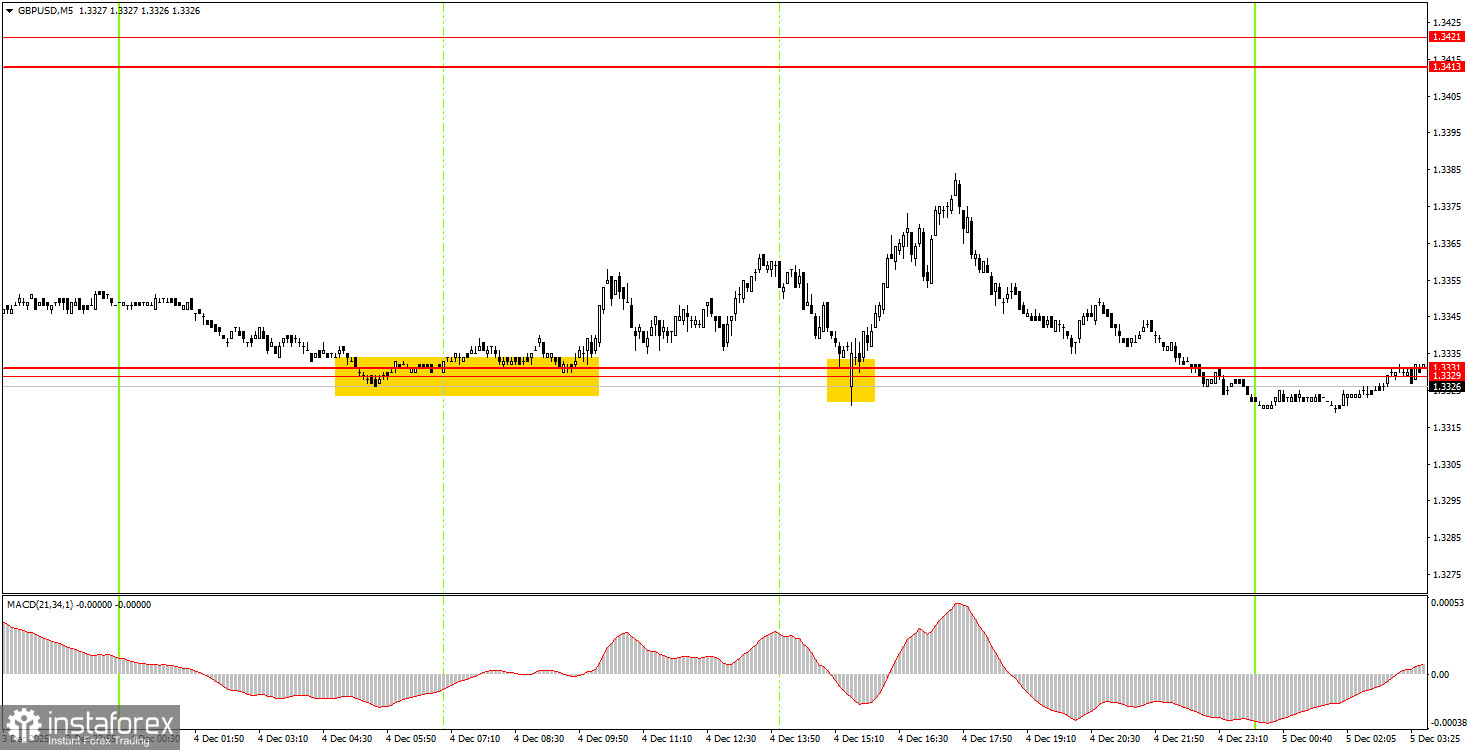
5M Chart of the GBP/USD Pair
On the 5-minute timeframe, two quite good buy signals were generated yesterday. The price first bounced off the area of 1.3329-1.3331 and then bounced once more. In both cases, beginner traders could have opened long positions. The price moved up 20 pips initially and then 40 pips in the second instance. As volatility was weak once again (as we had warned), profits could only be obtained through manual trade closures.
How to Trade on Friday:
On the hourly timeframe, the GBP/USD pair has resumed forming a local upward trend. As previously mentioned, there are no global grounds for medium-term dollar growth; therefore, we expect only northward movement. The correction/flat on the daily timeframe may not yet be over, but any local trend on the hourly timeframe is a potential resumption of the global trend.
On Friday, beginner traders may again expect trade signals to be formed in the area of 1.3329-1.3331. A consolidation above this area will allow new long positions to be opened, targeting 1.3413. A consolidation below it will lead to short positions targeting 1.3259-1.3267.
On the 5-minute timeframe, trading can currently take place at levels of 1.2913, 1.2980-1.2993, 1.3043, 1.3096-1.3107, 1.3203-1.3211, 1.3259-1.3267, 1.3329-1.3331, 1.3413-1.3421, 1.3466-1.3475, 1.3529-1.3543, and 1.3574-1.3590. On Friday, there are again no important events scheduled in the UK, while in the US, three reports will be released, each of which may provoke a cautious market reaction. These reports include the PCE index, the University of Michigan consumer sentiment index, and personal income/expenditures of American consumers.
Key Rules of the Trading System:
- The strength of a signal is assessed by the time it takes to form the signal (bounce or breakout). The less time it takes, the stronger the signal.
- If two or more trades were opened near any level based on false signals, all subsequent signals from that level should be ignored.
- In a flat, any pair can create numerous false signals or none at all. In any case, it's better to stop trading at the first signs of a flat.
- Trades are opened during the period between the start of the European session and the middle of the American session, after which all trades must be closed manually.
- On the hourly timeframe, when trading based on signals from the MACD indicator, it is preferable to trade only when good volatility is present, and a trend is confirmed by a trend line or channel.
- If two levels are positioned too closely to each other (5 to 20 points), they should be viewed as a support or resistance area.
- After moving 20 pips in the right direction, set the Stop Loss to breakeven.
Chart Explanation:
- Support and Resistance Levels: Levels that serve as targets for opening buys or sells. Take Profit levels can be placed near them.
- Red Lines: Channels or trend lines that reflect the current trend and indicate the preferred direction for trading.
- MACD Indicator (14, 22, 3): A histogram and signal line, a supplementary indicator that can also be used as a source of signals.
Important Note: Significant speeches and reports (always included in the news calendar) can greatly influence the movement of the currency pair. Therefore, during their release, it is advisable to trade cautiously or exit the market to avoid sharp reversals against the preceding movement.
Remember: For beginners trading in the Forex market, it is important to understand that not every trade can be profitable. Developing a clear strategy and practicing money management are keys to long-term trading success.